Let's get something out of the way immediately. If you've been hearing that AI is going to "solve" sports betting and print money while you sleep, I need you to sit down, because I'm about to save you some very expensive disappointment. The reality of AI in MLB handicapping is way more interesting than the fantasy, way more useful than you'd expect, and way more limited than the hype merchants want you to believe. We've been deep in this world for a while now, testing everything from neural networks trained on Statcast pitch data to large language models breaking down bullpen fatigue patterns, and what we've found is genuinely worth your time. Just not for the reasons you might think.
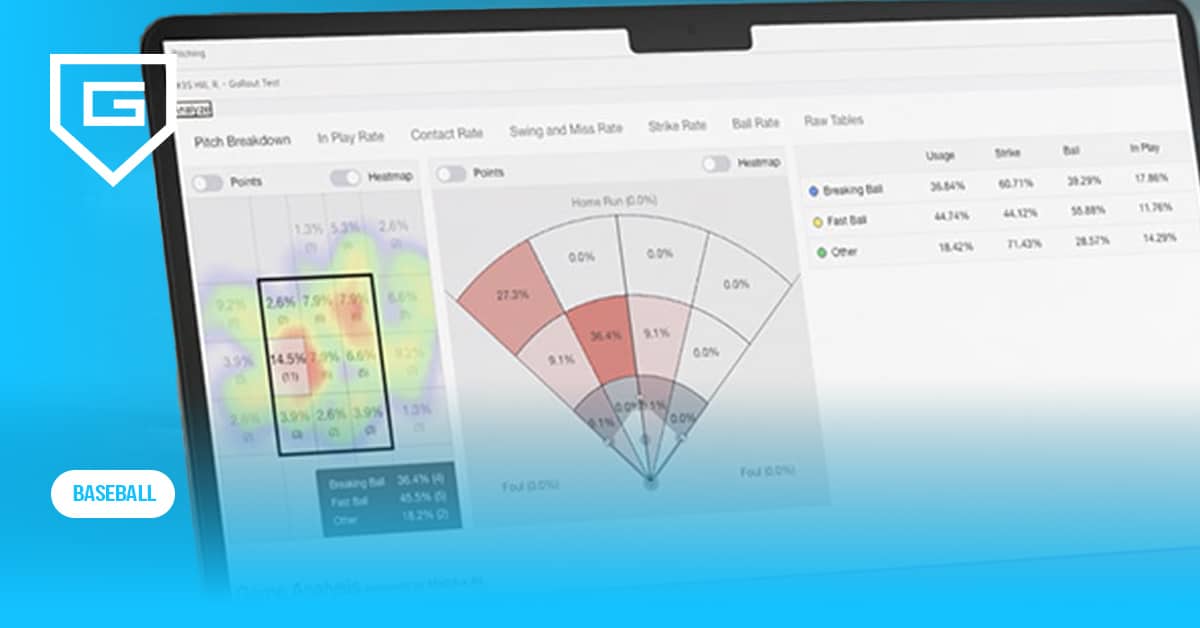
AI-powered analytics are transforming how teams and bettors analyze baseball. Photo: GoRout
The Numbers Don't Lie, But They Don't Brag Either
Here's what we know from actual testing, not marketing decks. Peer-reviewed academic research puts the accuracy ceiling for MLB game outcome prediction somewhere between 55% and 62%. That's from a study published in PMC that tested multiple approaches, including convolutional neural networks, support vector machines, and good old logistic regression, using five seasons of MLB data. Meanwhile, platforms like Leans AI are reporting their model "Remi" delivers a 53% to 58% win rate across major sports using what they call Reinforced Recursive Machine Learning.
I know what you're thinking. 55 to 62 percent? That's it? But hang on a second, because context matters enormously here. In sports betting, the break-even point against standard -110 juice sits right around 52.4%. So a model that genuinely, consistently hits 56 or 57 percent isn't just "slightly better than average." It's printing money over a full season. The problem has never been whether AI can find an edge. The problem is whether it can sustain that edge night after night across 2,430 regular season games while the market adjusts around it.
What The Best Models Are Actually Doing Under The Hood
Forget the buzzwords for a minute. Let me tell you what's actually happening inside the models that are producing real results. One of the most fascinating approaches we've come across is a project documented earlier this month that clusters MLB pitchers into eight distinct archetypes using K-Means clustering on their pitch mix, velocity, and movement profiles. Power arms, soft-tossers, sinker-ballers, breaking-ball specialists, hybrids. Instead of relying on tiny head-to-head sample sizes between a specific batter and a specific pitcher (which are usually garbage statistically), the model learns that a hitter struggles against an entire archetype. That dramatically expands the usable data pool and makes the predictions way more stable.
The data backbone? Roughly 4.9 million pitch records from MLB Statcast covering 2021 through 2025. Every single pitch includes velocity, spin rate, movement, launch angle, exit velocity, and outcome. Layer FanGraphs plate discipline metrics and park factors on top of that, and you've got a model that understands not just what happened, but the quality of contact underneath what happened. It's the difference between knowing a pitcher gave up three hits and knowing those three hits came off 72 mph exit velocities on poorly barreled balls that just happened to find grass.
Why Statcast Metrics Like xwOBA and Barrel Rate Matter For Bettors
If you're not paying attention to xwOBA and barrel rate, you're leaving edges on the table. Full stop. Here's why these matter more than traditional stats for handicapping.
Barrel rate measures the percentage of batted balls struck at 98+ mph exit velocity with a launch angle between 25 and 30 degrees. It correlates to home runs at 0.550, which is extremely strong. More importantly for us, barrel rate is one of the most reliable year-to-year metrics in baseball, right up there with strikeout rate and walk rate. That means when a hitter's barrel rate stays elite but his home run total dips, you're looking at a regression candidate. And regression candidates are where the money lives.
xwOBA, or Expected Weighted On-Base Average, takes exit velocity, launch angle, and sprint speed to calculate what a player's production should have been based on contact quality alone, stripping out defense and luck entirely. When a pitcher's xwOBA is significantly lower than their actual wOBA, they've been getting lucky and their numbers are likely to come back to earth. When the gap goes the other way, they've been getting unlucky and are probably better than their surface stats suggest. This is the kind of information that traditional handicappers just don't have access to, or don't know how to use.
There's a catch, though. xwOBA badly needs a ballpark adjustment. You get wildly different outcomes for identical batted balls depending on the park. Citizens Bank Park produces 84% higher home run rates than Oracle Park, according to research from Baseball Prospectus using the Singlearity neural network. A model that ignores park context is a model that's going to get burned.
Ballpark Pal and the Park Factor Revolution
Speaking of parks, one of the tools that's quietly become essential for serious MLB handicappers is Ballpark Pal. Their park factor model is trained on over one million batted balls and 20,000+ games since 2016, using machine learning to isolate the unique weather impact at each stadium. What makes their approach interesting is that they don't just assign a blanket park factor to a venue. They assign park factors to individual hitters based on where they typically hit the ball. A dead-pull lefty hitter gets a different Coors Field adjustment than a guy who sprays line drives to all fields. That level of granularity is where AI starts to genuinely separate itself from the eyeball test.
For betting purposes, this matters most on totals. An over/under set at 8.5 in a game at Coors means something completely different than 8.5 at Oracle Park, but even within the same stadium, the number means different things depending on the specific lineups, the weather that specific day, and the handedness matchups between starters and opposing batting orders. AI handles all of those variables simultaneously. A human can hold maybe four or five of them in their head at once. That gap is real.
Spring Training is a Beautiful, Terrible Testing Ground
We're right in the middle of it now, and I'll be blunt: spring training is the worst possible environment for machine learning models. Managers are splitting innings between a dozen pitchers. Non-roster invitees are hitting fifth against a starter who's working on a new changeup grip and couldn't care less about the result. Lineup cards look like they were assembled by a random number generator.
All the patterns that ML models depend on, pitcher performance against specific lineups, bullpen usage tendencies, batting order optimization, none of it applies in February and March the way it does in August. Every model we've tested shows noticeable accuracy degradation on spring training data, and honestly, it would be alarming if they didn't. The signal-to-noise ratio is brutal.
But here's what spring training is good for, and this is something we're actively exploring. Statcast still tracks everything. Velocity readings, swing decisions, batted-ball quality metrics, they're all flowing in. Those data points can serve as early indicators of player readiness heading into the regular season. The challenge, and it's a big one, is knowing which spring training signals actually translate and which are just noise from a relief pitcher facing minor leaguers who'll be in Double-A by April. We're building filters for that. We'll let you know if they work.
The ABS Challenge System Changes Everything (Maybe)
Here's the wild card nobody in the handicapping space is talking about enough. MLB is rolling out the Automated Ball-Strike Challenge System across all 30 parks in 2026. Twelve synchronized Hawk-Eye cameras with 5G connectivity tracking every pitch within one-fifth of an inch. Each team gets two challenges per game. During Spring Training 2025 testing across 288 games, there were an average of 4.1 challenges per game, with challenges succeeding 52.2% of the time. And 72% of fans surveyed said the system had a positive impact on their experience.
For prediction models, this introduces genuine uncertainty. A more accurate and consistent strike zone could meaningfully shift pitcher performance profiles, walk rates, and how batters approach two-strike counts. It could make certain pitchers who relied on borderline calls look worse overnight and make others who got squeezed by human umpires look better. Defensive players succeeded on challenges at a 54.4% rate compared to 50% for hitters during testing, which hints that pitchers might get a slight net boost from the system. We won't really know until we've got regular season data under the new rules, though. For now, it's the most fascinating unknown variable in our models.
The Proprietary Arms Race You Can't See
Here's something that keeps me up at night thinking about market efficiency. MLB teams themselves are deep in the AI game, and they're not sharing what they've built. The Red Sox have a proprietary system called "Beacon" that combines multiple data sources into custom projections no other organization has access to. Every single MLB team now has an analytics department, and they're all building proprietary algorithms designed to extract competitive advantages from the same Statcast data pool. A single game generates roughly 15 million data points, and the teams with the best models are the ones figuring out which of those 15 million actually matter.
What does this mean for bettors? It means the information asymmetry between teams and the public is growing, not shrinking. The data is free on Baseball Savant. Anyone can pull Statcast leaderboards. But the modeling that sits on top of that data, the secret sauce that tells you which variables actually predict outcomes versus which ones are just noise, that's where the real value lives. And teams aren't selling that.
This is exactly why we test AI tools obsessively at Daily MLB Picks. We can't match what a team's analytics department has built. But we can get closer than a guy with a newspaper and a hunch. Way closer.
What Actually Works For Bettors Using AI Right Now
After months of testing, here's where we've landed on what a realistic, effective AI-assisted handicapping process looks like in 2026. No fairy tales. No promises. Just what we've seen work.
First, don't let any single AI model make the final call. None of them are good enough for that yet. The best approach we've found is layered. Use specialized models for data aggregation, stuff like pitcher archetype matchups, park-adjusted contact quality, and bullpen fatigue tracking. Use LLMs for qualitative synthesis, pulling together injury context, managerial tendencies, and situational factors into something you can process quickly. Then apply your own judgment as the tiebreaker.
Second, pay attention to Closing Line Value. The top-performing AI models are beating closing lines by 3% to 7% on average across different sports. That's the real signal that a model has genuine predictive power, not its raw win-loss percentage on past picks. If you're consistently getting better numbers than what the line closes at, you've found something real.
Third, be brutally honest about accuracy expectations. The range for MLB specifically is somewhere around 54% to 61% for well-built models, depending on methodology. If someone tells you their baseball AI hits 80% or 90%, they either haven't run enough games or they're measuring something other than straight game outcomes. The inherent randomness of a sport where the best teams lose 60 games and the worst teams win 60 creates a ceiling nobody has convincingly broken through.
The AI sports betting market is projected to grow from $10.8 billion in 2025 to over $60 billion by 2034. That kind of money doesn't flow into a dead end. The tools are getting better, the data is getting richer, and the models are learning from their mistakes in real time. We're not at the "solved" stage. We might never get there in baseball. But we're at the stage where ignoring AI in your handicapping process means you're bringing a knife to a gunfight. And the other side has a lot of guns.