The Bet That Does Not Care Who Wins
This was the board as of 2026-08-03. Any price quoted below is the price that was available at that time, not a current quote. Kept online with its original analysis intact; present-tense wording has been corrected so nothing here reads as live.
Cincinnati Can Lose that night And The Biggest Play Still Wins
Say the Athletics beat the Reds 8-6. Under that scoreline the two moneyline tickets on this card lose, the crowd at Great American Ball Park goes home unhappy, and the largest single bet of the night, two units on the Cincinnati team total, cashes comfortably. Six is more than 4.5. The market never asked about the other team.
That is the whole idea, and it is the reason a team total is the single most useful market for someone learning to bet baseball. You are not predicting a winner. You are predicting one lineup against one pitching staff, which is a much smaller question with far fewer moving parts.
Beginner Note: What A Team Total Is
A game total asks how many runs both teams combine to score. A team total asks how many runs one specific team scores, and it ignores the other side of the scoreboard completely. that night's line is Cincinnati over 4.5, so the Reds need to score five runs. They can win 5-2 or lose 5-11, and both results settle exactly the same way. When you are studying a matchup and you find yourself confident about one lineup rather than about the outcome, this is the market that lets you bet only the part you understand.
What These Four Prices Cost You
Before forming an opinion about any number, convert it into a percentage. For a favorite, divide the price by itself plus 100. So -115 becomes 115 divided by 215, or 53.5 percent. That is how often the Reds need to score five runs for this ticket to break even long term.
Run the same arithmetic on the rest and the shape of the card appears immediately.
| Play | Price | Units | Break-Even |
|---|---|---|---|
| Reds Team Total Over 4.5 | -115 | 2.0 | 53.5% |
| Reds Moneyline | -129 | 1.5 | 56.3% |
| Dodgers Moneyline | -184 | 3.0 | 64.8% |
| Mariners Moneyline | -118 | 1.0 | 54.1% |
The Dodgers ticket needs to be right more than eleven percentage points more often than the Mariners ticket just to arrive at the same place. That is what a bigger number actually means, and it is why the largest stake on this card also carries the heaviest burden of proof.
Play One: Reds Team Total Over 4.5, Two Units
Oakland starts J.T. Ginn, who is genuinely good and genuinely wild. His earned run average is 3.46 and hitters bat .211 against him, but he has walked 49 men in 109.1 innings. His pitch mix explains it: a sinker 33.4 percent of the time at 93.5 mph, then a changeup, a cutter, a slider and a four seamer, none of them thrown more than a fifth of the time. Everything he throws moves, and moving pitches miss the strike zone.
Look at July 1 against the Dodgers. Six innings, three hits, one earned run, five walks, 104 pitches. He was excellent, and he was still finished after eighteen outs.
What comes next is the actual bet. The Athletics pitching staff carries a 5.42 earned run average and a 1.50 WHIP and has given up 176 home runs across 995.1 innings. On August 2 in Detroit five different relievers combined for an 11-0 loss, one of them giving up four earned runs in a single inning. Cincinnati does not need to solve Ginn to clear five runs. It needs to still be batting in the seventh.
The ballpark helps. Great American Ball Park is 325 feet down the right field line and 370 to right center, and the Reds have hit 79 of their 145 home runs at home in 57 games. Sal Stewart has 24 home runs and 85 runs batted in, Elly De La Cruz carries an .855 OPS, and JJ Bleday has drawn 50 walks in 295 at bats, which is the sort of patience that turns a 49 walk pitcher into a short outing.
The Honest Part
Cincinnati averages 4.16 runs per game, 24th in baseball, and this bet asks that offense to clear 4.5 against a starter with a 3.46 earned run average. The home split gives no comfort either: the Reds have scored 231 runs in 57 games at home and 231 in 54 games on the road. The park adds home runs and it does not add runs. Every dollar here rides on Oakland's pitching being poor rather than on Cincinnati's hitting being good.
Play Two: Reds Moneyline, And Why It Is Not A Second Bet
The same game shows up again at -129. Cincinnati's own starter, Brady Singer, is the weakest arm on this card by almost every measure: a 4.68 earned run average, a 1.43 WHIP, 21 home runs allowed and a .273 opponent batting average. He throws a sinker 47.5 percent of the time at 91.3 mph and a slider 29.6 percent at 82.6, and when the sinker is down he looks like the man who threw seven shutout innings against Milwaukee on June 22.
The price is really about the opponent. Oakland is 45-67, has lost five straight, is 2-8 over its last ten games and is 24-31 away from home. Cincinnati is 14-12 in one run games and 7-4 in extra innings.
Beginner Note: Two Tickets, One Outcome
These two plays are correlated, which means they tend to win together and lose together. If Cincinnati scores five runs off that Oakland staff, the Reds usually win the game too. If Singer gives up six in the third and the game gets ugly early, both tickets are in trouble at once. Treat the 2 units and the 1.5 units as a single 3.5 unit position on one game rather than as two independent bets, and size the rest of your night accordingly. New bettors routinely take four or five correlated tickets, believe they are diversified, and discover at 10pm that they had one enormous bet all along.
Play Three: Dodgers Moneyline, Three Units
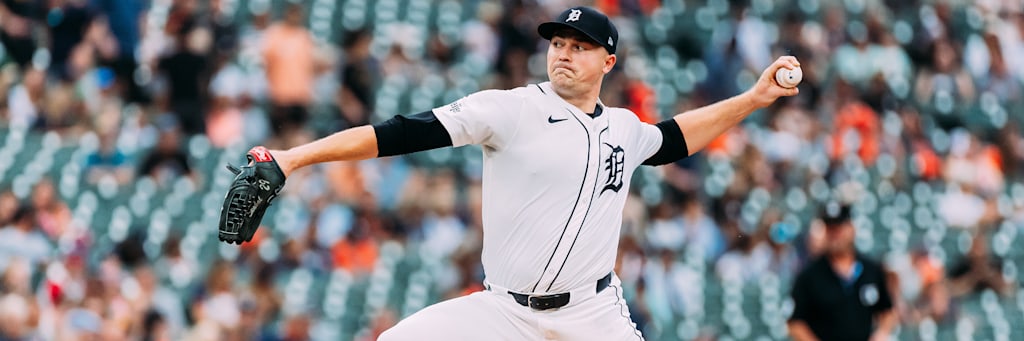
Skubal is the best pitcher working that night and it is not especially close. A 2.79 earned run average, a 0.91 WHIP, 116 strikeouts and 14 walks in 96.2 innings. He leads with a four seam fastball at 96.7 mph on 36.5 percent of his pitches and pairs it with a changeup at 87.2 mph on a quarter of them, a ten mile per hour gap thrown from the same arm slot. On July 24 he struck out twelve Royals over seven and a third innings.
The other half of the case is where Los Angeles hits. The Dodgers have scored 329 runs in 57 road games, 5.77 per game, batting .273 with an .800 on base plus slugging away from home. At Dodger Stadium those numbers fall to 248 runs in 56 games and a .740 mark. Shohei Ohtani carries a .940 OPS with 67 walks and Freddie Freeman is hitting .309. This is a road team that gets better on the road.
Chicago counters with Javier Assad, and his most important number is a workload number. He has not recorded eighteen outs in a game since June 12. His eight appearances since then ran 5.2, 5.0, 2.2, 4.2, 5.0, 1.0, 3.0 and 4.1 innings. Whatever happens in the first four innings, a Cubs bullpen belonging to a staff that has allowed 168 home runs is going to face the middle of the Los Angeles order.
The Honest Part
Chicago has the second best offense in baseball at 5.13 runs per game, is 32-24 at Wrigley Field and scored 286 runs in those 56 home dates. Pete Crow-Armstrong is carrying a .919 OPS with 24 home runs and 26 stolen bases. The Cubs beat these same Dodgers 10-5 in this ballpark last night and Los Angeles has now lost four in a row. Laying -184 into that means winning 64.8 percent of the time, which is a lot to ask when the opponent just put ten runs on you.
Play Four: Mariners Moneyline, One Unit
Emerson Hancock has the largest workload of any starter that night, 110.1 innings across 20 starts, with a 3.26 earned run average and a 1.04 WHIP. The mechanism is a velocity gap most hitters never see twice in an at bat. His four seam fastball averages 95.4 mph and he throws it 39.3 percent of the time. His sweeper averages 77.1 mph and he throws it 17.2 percent of the time. Eighteen miles per hour of separation, deployed almost one pitch in six, is why a pitcher who strikes out 8.32 per nine keeps the bases so empty. On July 5 he held Toronto to two hits over seven innings in this park.
T-Mobile Park is 390 feet to left center and 387 to right center, one of the largest outfields in the sport, and Seattle is 32-24 at home against 23-34 on the road. Detroit is 24-31 away, 12-20 in one run games and 3-7 in extra innings, which describes a team that keeps losing the games it fails to put away.
The Honest Part
Seattle ranks 28th in baseball at 4.02 runs per game and does not improve at home, scoring 226 runs in 56 home dates. Detroit sends out Troy Melton, whose 1.75 earned run average and .174 opponent batting average are the best run prevention numbers on the board. Backing a 55-58 team that cannot hit, against that, is a bet on Hancock and on the outfield gaps and on nothing else. That is worth one unit. It is not worth more.
How The Model Reads A Night Like This
Automated systems handle a team total differently from a moneyline. A moneyline collapses a whole game into one binary outcome, while a team total keeps the shape of the run distribution intact and asks only where the 4.5 line falls inside it. That makes park factors, bullpen quality and opposing walk rates unusually heavy inputs, and it makes the opposing team's offense worth nothing at all. that night the single most heavily sampled figure on the entire card is the Athletics staff earned run average across 995.1 innings, which is roughly nine times the evidence behind any individual starting pitcher here.
The staking follows the strength of the read rather than the comfort of the price. Los Angeles carries the largest stake at the steepest number because the underlying edge, a starter with eight strikeouts for every walk against a starter who cannot finish the fifth, is the most durable thing on the board.
What that night Means For The Futures Board
Two of these games sit inside races worth tracking. Los Angeles is 69-44 and leads the National League West, sitting one loss behind Milwaukee at 69-43 for the best record in baseball. Chicago is 64-49 and trails Milwaukee by 5.5 games in the National League Central, so a Cubs win that night is worth more to their division math than a Dodgers win is to theirs.
Seattle is the quieter story. At 55-58 the Mariners are three games below even and still only 2.5 games out of first in the American League West, which is the kind of standing that turns every home game in August into a leverage spot. Detroit at 54-58 is 5.5 back in the American League Central. Cincinnati, at 53-58 and 15.5 games back, and Oakland at 45-67 and 12 games back, are both playing for next season, and that changes how hard a manager pushes a bullpen in the eighth inning of a Tuesday game. Track the standings movement on our futures tracker.
Card Summary
Sources And Editorial Review
Teams, game identity, venues and probable pitchers for this card were checked against the official MLB schedule, with records and pitcher statistics cross-checked on the ESPN MLB scoreboard. Odds are the pregame snapshots shown on the card and can move after publication.
This article is AI-assisted: automation helped assemble the statistical comparison, calculate break-even percentages and draft the matchup breakdown, and the Daily MLB Picks editorial desk completed a review of the markets, math, matchup names, source links and risk language before publication. Read the full editorial, sourcing, grading and corrections policy.