AI Pick: Yankees Moneyline -107 And The AL Wild Card Board
This was the board as of 2026-08-17. Any price quoted below is the price that was available at that time, not a current quote. Kept online with its original analysis intact; present-tense wording has been corrected so nothing here reads as live.
Nine Games On The Board And Only One Bet
Thursday offers nine games, from St. Louis at Cincinnati at 12:40 in the afternoon to the Angels at Houston at 8:10 at night. The card contains exactly one position: the New York Yankees moneyline at -107 for a single unit, in the 6:35 game at Oriole Park at Camden Yards. Eight other games were looked at and passed on. That is normal and it is healthy, and if you are new to this, the habit of skipping games you do not have a reason to bet is worth more than any single pick will ever be.
Beginner Note: What -107 Means
A moneyline is a bet on who wins, with no margin attached. A minus number tells you how much you have to risk to win 100 dollars. At -107 you risk 107 to win 100. To break even over the long run, a bet at that price has to win 51.69 percent of the time. Anything above that is profit, anything below is loss. Because 51.69 percent is barely more than half, -107 is the market saying the game is close to a coin flip.
That is the starting point for everything below. The machine is not being asked whether the Yankees are far better than the Orioles. It is being asked whether they are more than 51.69 percent likely to win one baseball game, which is a much lower bar.
The Batting Numbers Cancel Each Other Out
Here is the awkward part of this matchup. Neither of these teams can hit.
New York bats .229 as a club with a team OPS of .715, which ranks 17th out of 30. Baltimore bats .236 with a .718 OPS, which ranks 16th. They are separated by three thousandths of a point in the one number that best summarizes an offense. Baltimore has actually scored more runs this season, 573 to 559.
Beginner Note: OPS
OPS stands for on base plus slugging. It adds how often a hitter reaches base to how much power he shows when he does. It is a rough number rather than a perfect one, but it sorts offenses quickly. Around .720 is league average territory. The two clubs in that night's game sit at .715 and .718, which is the statistical equivalent of a tie.
So the model gets no signal from the hitting side. It moves to the other column.
One Hundred And Thirty Four Runs Of Separation
New York has allowed 470 runs in 126 games. Baltimore has allowed 604 in 127. That is a difference of 134 runs, and it is the entire reason this card exists.
The Yankees carry a team earned run average of 3.24, which is the lowest figure in all of Major League Baseball this season, ahead of Milwaukee at 3.48 and Boston at 3.52. Baltimore sits 19th at 4.23. Hitters facing New York manage a .224 average and a .657 OPS. Hitters facing Baltimore manage .254 and .731.
Beginner Note: Run Differential
Run differential is runs scored minus runs allowed. It is the single most useful shortcut for judging whether a team is genuinely good, because it is far less noisy than a win loss record. New York is at plus 89. Baltimore is at minus 31. A gap that size between two clubs playing each other is the sort of thing a model weights heavily, especially when the price implies the two are even.
The road split makes it sharper. Away from Yankee Stadium, New York pitching has a 2.92 earned run average across 68 games and has allowed 229 runs, roughly 3.4 per night. The Yankees are 40-28 on the road and 31-27 at home, which is a strange shape for a team to have and a useful one for a road bettor.
The Pitcher Who Walks People And The One Who Does Not
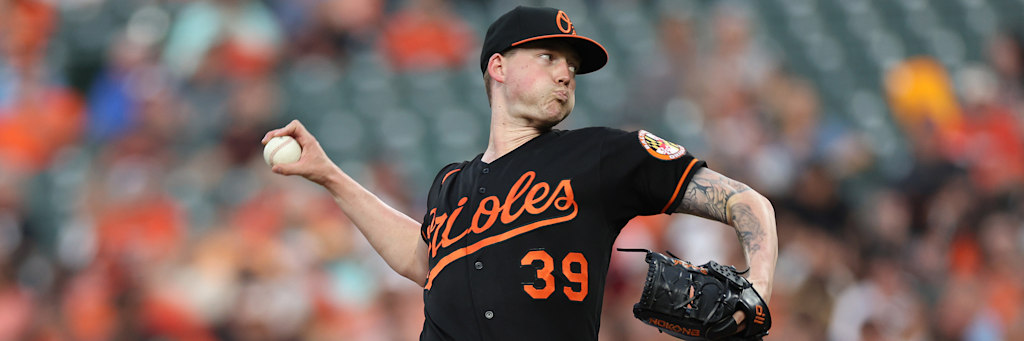
Gerrit Cole starts for New York. He is 6-6 with a 3.22 earned run average, 92 strikeouts and 19 walks across 86.2 innings in 15 starts. Kyle Bradish starts for Baltimore. He is 7-11 with a 3.65 earned run average, 124 strikeouts and 58 walks across 133.0 innings in 24 starts.
Look at the walk columns rather than the earned run averages. Cole has issued 19 free passes all year. Bradish has issued 58. Expressed as a rate, Cole walks 5.4 percent of the hitters he faces and Bradish walks 10.3 percent. Nearly double.
Cole has also been at his sharpest recently. Over his last five starts he has thrown 31.2 innings with 37 strikeouts, seven walks and seven earned runs. On July 22 he struck out 11 Pirates in seven innings and walked nobody. On August 8 he threw seven innings in Atlanta on only 82 pitches, again without a walk.
Bradish has drifted the opposite way. Fourteen strikeouts in his last four starts covering 19.2 innings. His August 2 outing against Philadelphia lasted three innings and 53 pitches. On August 15 against Tampa Bay he walked four hitters in six innings while striking out three.
Why The Ballpark Punishes Walks
Oriole Park at Camden Yards has a right field line listed at 318 feet, with 333 down the left field line, 376 to left center, 410 to dead center and 373 to right center. It is an open air park on natural grass, 33 feet above sea level, seating 44,970.
That 318 foot corner is the shortest regular corner in the sport. For a pitcher who gives away bases, the math is unforgiving: put a man on for free, then miss with one pitch, and a solo home run becomes a two run home run. Bradish has walked 29 hitters in 59.1 innings inside this park and has allowed 13 home runs on the season.
What Could Go Wrong, Stated Honestly
A card with one bet on it should be honest about that bet, so here is the case for the other side.
Cole has thrown 86.2 innings in 15 starts, an average of 5.78 per outing, and he has not completed a seventh inning once this season. His highest pitch count of the year is 103. He is on a managed workload, which means the bullpen will be asked to cover three or four innings that night no matter how well he pitches.
Baltimore is the worst possible opponent for a starter on a pitch limit. The Orioles have drawn 488 walks, third most in baseball behind the Cubs at 544 and the Brewers at 534. At home they have taken 260 walks in 64 games. Pete Alonso has 63 walks and gets on base at a .359 clip. Gunnar Henderson has 52. Jackson Holliday has drawn 34 in only 259 plate appearances. A patient lineup can run a pitch count up in a hurry.
Bradish is better at home than on the road, which cuts against everything above. His Camden Yards line reads a 3.34 earned run average, a 1.16 WHIP and a .188 opponent batting average across 59.1 innings. On the road those numbers become 3.91, 1.52 and .293. Cole runs the opposite split, with a 0.87 WHIP at home and 1.29 away.
And the Yankees offense is worse on the road than it looks on paper. In 68 road games New York hits .227 with a .299 on base percentage and a .683 OPS, striking out 656 times. At home the same group posts a .753 OPS. Ben Rice and his 34 home runs are genuine, and past him the travelling lineup gets thin.
The Futures Board Says Baltimore Is Not Dead
This is the part most people miss when they look at a 61-66 team and assume it has nothing to play for.
| AL East | Record | Games Back | Last 10 |
|---|---|---|---|
| Tampa Bay Rays | 76-50 | Leading | 6-4 |
| New York Yankees | 71-55 | 5.0 | 6-4 |
| Boston Red Sox | 68-59 | 8.5 | 4-6 |
| Toronto Blue Jays | 62-66 | 15.0 | 6-4 |
| Baltimore Orioles | 61-66 | 15.5 | 5-5 |
Baltimore is 15.5 games out of first place, which reads like a finished season. The wild card standings tell a different story. The Orioles sit seventh in the American League wild card order at 61-66, only 1.5 games behind the third and final spot. The Yankees hold the top wild card position and are nine games clear of the cut line.
Beginner Note: Futures And Why They Matter that night
A futures bet is a wager on a season long outcome, such as a division title or a playoff berth, placed before the outcome is settled. You do not need to hold one for the standings to matter to you. A team 1.5 games out of a playoff spot plays differently than a team that has quit, and that shows up in bullpen usage, in pinch hitting decisions and in how long a manager sticks with a struggling starter. that day's card carries no futures position at all. The board is context, not a bet.
So the honest reading of that night is that Baltimore has a reason to empty the tank. The Orioles have lost three straight, they have already dropped the first two games of this series at home by scores of 3 to 1 and 5 to 3, and a third loss digs the wild card hole deeper. A desperate team at home is a real factor, and it is priced into that -107 more than the raw records suggest.
What The Machine Actually Decided
Strip the card back to its shape. Both offenses are below average and nearly identical. One club prevents runs better than any team in baseball and does it even better on the road. The other has allowed 134 more runs and hands the ball to a pitcher whose strikeouts have dried up while his walks have not. The price for backing the first club is 51.69 percent.
The Yankees have won three in a row and are 40-28 away from home. That is the play, at one unit, and it is the only play.
Sourcing And Disclosure
Every record, earned run average, innings total, strikeout count, walk count, batters faced figure, ballpark dimension and standings position in this piece was pulled from live league statistics during this session, along with the nine-game schedule and both probable starters. Home and road splits are separated splits rather than season totals. Odds are pregame snapshots and can move after publication.
This article is AI-assisted: automation helped assemble the statistical comparison, calculate the break-even percentage and draft the matchup breakdown, and the Daily MLB Picks editorial desk completed a review of the markets, math, matchup names, source links and risk language before publication. Read the full editorial, sourcing, grading and corrections policy.